1
Too much data, too little direction
Separate exports and spreadsheets show plenty of figures, but don't automatically indicate where action is needed.
Turn trips, vehicles, drivers, costs, and usage into clear dashboards and reports that operations and management can use right away.
Standard and custom reports
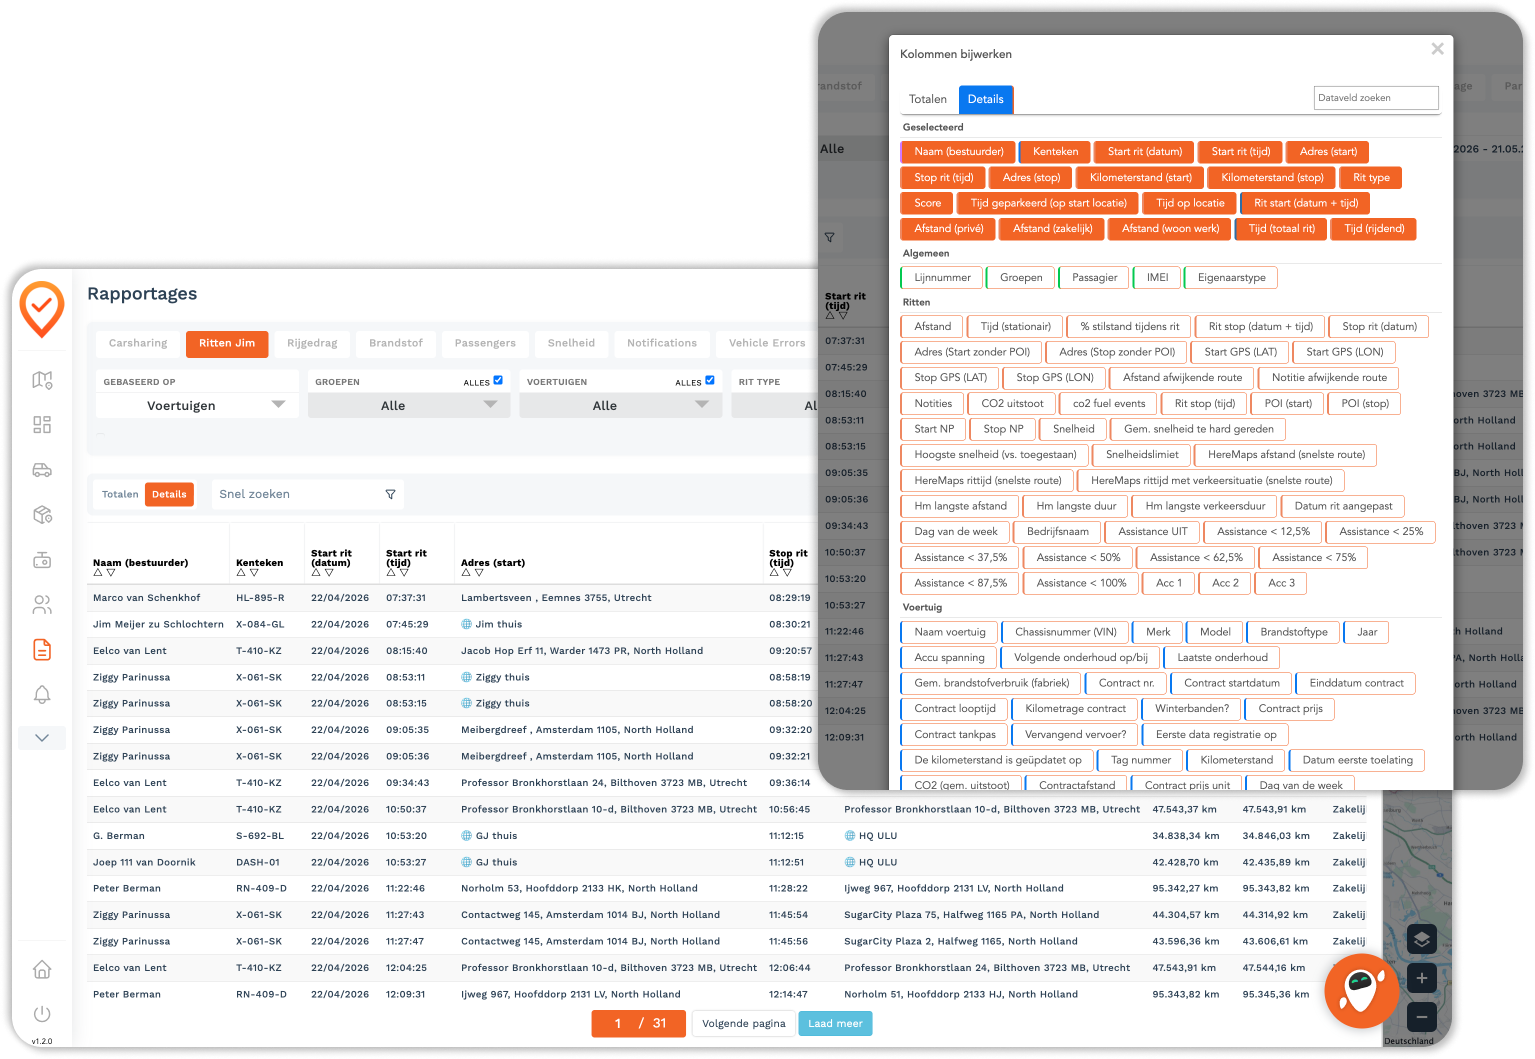
Select, save, and export columns
Clear overview of KPIs and deviations
Separate exports and spreadsheets show plenty of figures, but don't automatically indicate where action is needed.
Planning, finance, HR, and management use the same source data from different perspectives.
Manual selection, cleaning, and merging make periodic reporting unnecessarily labor-intensive.
Work with standard reports or build your own by selecting the columns and order you need.
Save your own reports, export them, and use the same reliable selection every time.
Identify anomalies in usage, mileage, downtime, costs, or driving behavior faster.
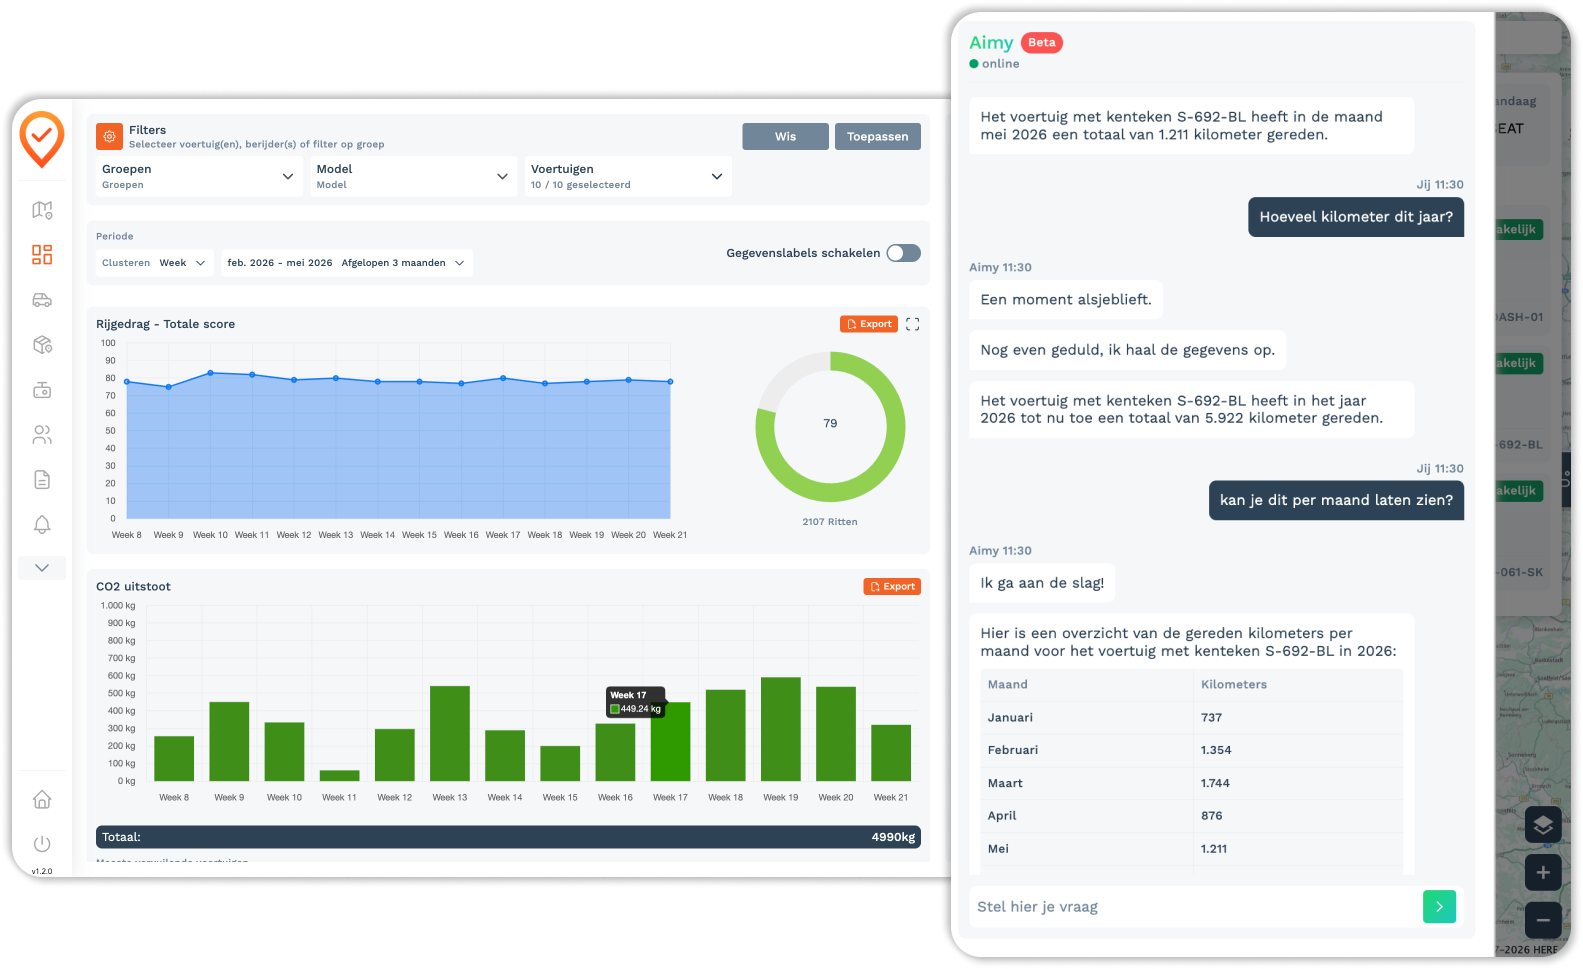
Dashboards and reports bring together anomalies, trends, and performance. You can identify where action is needed faster and back up your results.
This feature works with the same vehicles, drivers, trips, roles, and reports within Cartracker. One environment, one real-time data source.
View all features →Use real-time Cartracker data as a solid foundation for dashboards, exports, and recurring analyses.
View pricing & orderView fleet management →Gain real-time insight into your fleet and act directly on what truly matters. KPIs and reports fully integrated into Cartracker. From insight to action — automatically and effortlessly.

Many systems collect data. Cartracker ensures you can actually act on it.
With our KPI dashboards and reports, you not only gain insight into your fleet, but you also immediately see where you need to intervene. From costs per kilometer and vehicle usage to CO₂ emissions and driving behavior — everything comes together in one clear environment.
You see trends, deviations, and opportunities at a glance. Which vehicles are underutilized? Where do unnecessary costs arise? Which drivers deviate from norms? By making these insights immediately available, data becomes an active steering tool instead of a retrospective report.
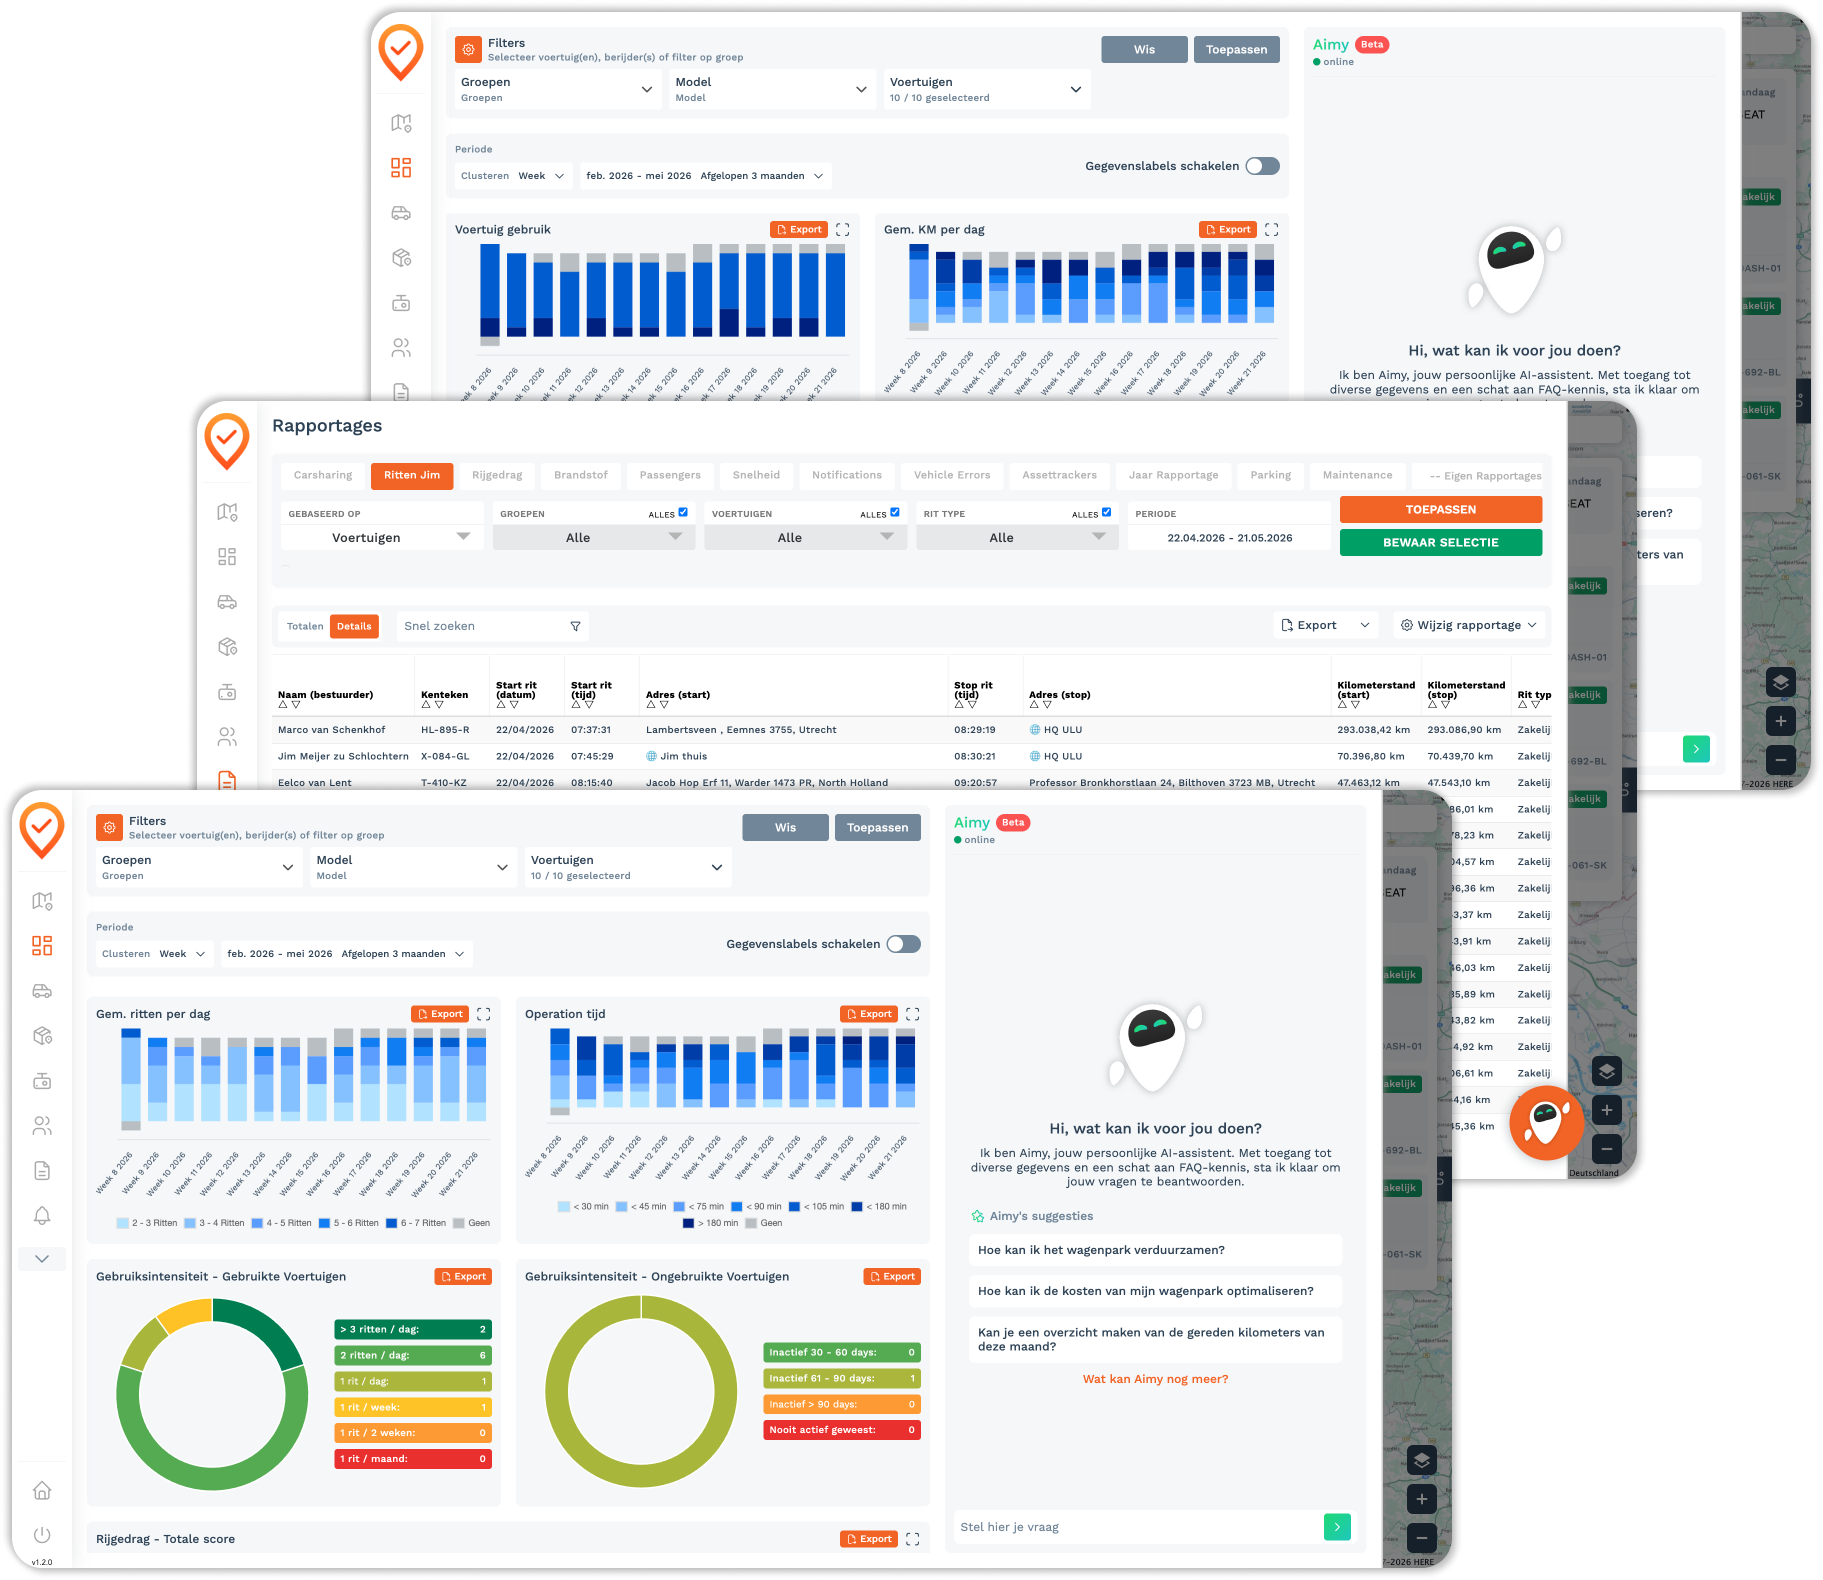
And if you're stuck? Aimy, our AI assistant, will help you immediately uncover the right KPIs and insights.

Our KPI dashboards give you immediate insight into the most important performance indicators of your fleet. From usage and downtime to costs and CO₂. You don't just see what's happening, but more importantly, where you need to make adjustments.

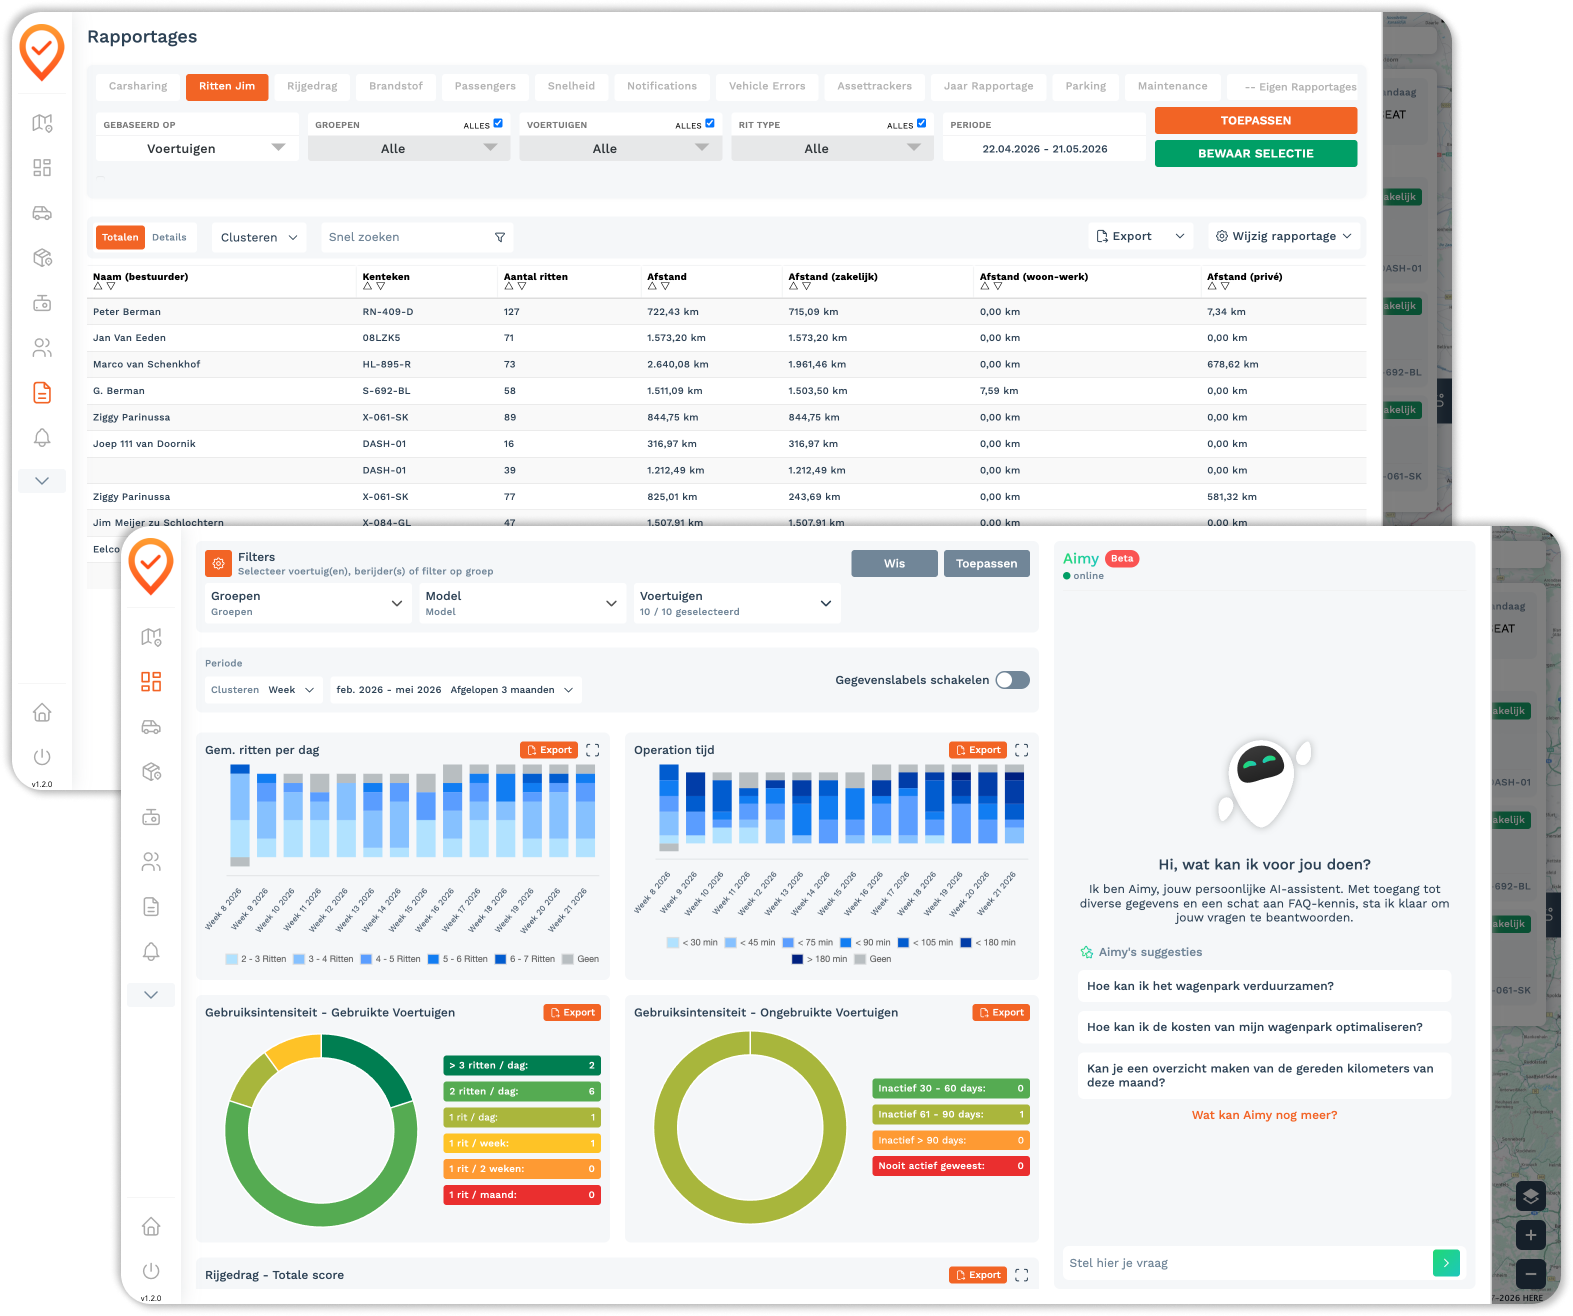
Easily compile your own reports based on all available data. Choose the fields that are relevant to you, apply filters, and create reports that align with your organization. Everything is flexible and fully customizable.

Have reports automatically generated and sent whenever you want. Receive notifications for important events and always stay informed, without actively logging in or collecting data.

From data to insight. Automatically and instantly.
Data is only valuable if you can act on it directly.
Cartracker automates the entire process of insights and reporting. KPI dashboards are continuously updated, and you can easily create reports yourself or have them sent automatically.
Smart filters allow you to delve into details and analyze exactly what is relevant for your organization. Additionally, you can set up notifications for specific events, so you are immediately informed when action is needed.
Do you want to link data to other systems? Our API provides access to all data within the platform, allowing you to integrate it into your own BI environment or data platform.
Everything is designed to unburden you: less manual work, more insights, and complete control over your fleet.